
Coinlyzer reads its prices and candles straight from Binance, Kraken and Coinbase. When a number looks different from your exchange app, the two are almost always measuring slightly different things. These five checks, in order, explain nearly every case.
1. Rolling 24h or today’s candle?
Exchange price lists usually show a rolling 24-hour change: the price now against the price exactly 24 hours ago. Coinlyzer has that column too (24h Chg), but most screens use candle changes, and today’s daily candle (1d Chg) only starts at 00:00 UTC. At the same moment, the two can be far apart:
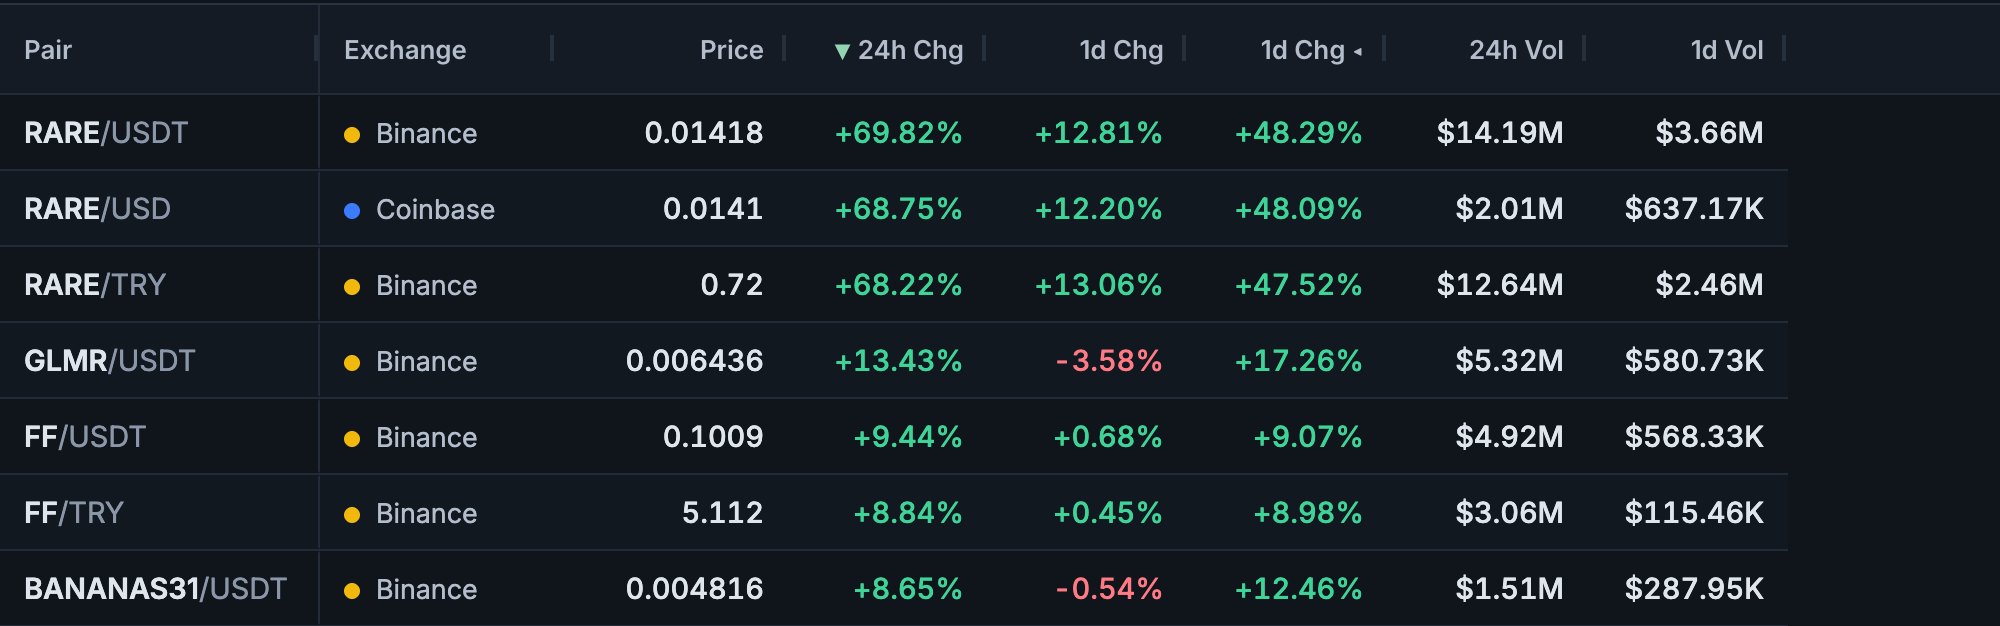
| RARE/USDT on Binance | Change | Measured from |
|---|---|---|
| 24h Chg (rolling) | +69.82% | The price 24 hours earlier, 05:38 UTC on 15 November |
| 1d Chg (today’s candle) | +12.81% | Today’s open, 00:00 UTC on 16 November |
| 1d Chg ◂ (yesterday’s candle) | +48.29% | Yesterday’s open to yesterday’s close |
GLMR/USDT, a few rows down, is the opposite case: +13.43% over 24 hours, yet −3.58% on today’s candle. It rose yesterday and has been falling since midnight UTC. Neither number is wrong. Make sure you compare the 24h number with your app’s 24h number, and candles with candles. The full story, with four months of data, is in 24h change vs the daily candle.
2. When does the day start?
Coinlyzer’s candles run on UTC, like the exchanges’ own data: the daily candle runs from 00:00 to 24:00 UTC, the 4-hour candles start at 00:00, 04:00, 08:00 and so on. Some exchange apps and charting tools let you pick a time zone for the chart or for the day’s change. With your local time zone selected, your daily candles start at your midnight and won’t match. Set the chart to UTC to compare.
Not sure when the UTC day turns over where you live? The candle close countdown shows it in your time zone.
3. Same coin, different market
Each row in Coinlyzer is one market: one pair on one exchange. The screenshot shows RARE three times, and each market has its own trades and its own numbers:
| Market | Price | 24h Chg | 1d Chg |
|---|---|---|---|
| RARE/USDT on Binance | 0.01418 USDT | +69.82% | +12.81% |
| RARE/USD on Coinbase | 0.0141 USD | +68.75% | +12.20% |
| RARE/TRY on Binance | 0.72 TRY | +68.22% | +13.06% |
Check the quote asset (USDT, USDC, USD, EUR, TRY…) and the exchange. BTC/USDT on Binance and BTC/USD on Coinbase are different markets, and their prices are rarely exactly the same. Prices stay in the pair’s own quote asset: the TRY pair is priced in lira.
4. Volume in dollars
Exchange apps often show volume in the coin itself (“24h Vol (RARE)”) or in the quote asset. Coinlyzer converts every volume to US dollars with a live rate, so pairs in USDT, EUR and TRY can be compared and sorted together. RARE/TRY’s $12.64M of 24h volume is lira volume converted to dollars; Binance’s app shows the same trading in RARE or in lira.
Candle volume adds a second difference: 1d Vol counts only what has traded since 00:00 UTC. At 05:38 UTC, RARE/USDT had $3.66M on today’s candle against $14.19M over the full 24 hours.
5. Timing and indicators
- Update speed. Your exchange app shows each trade. Coinlyzer updates about every second on Pro and every 15 seconds on Free, so on Free a fast-moving pair can be up to 15 seconds behind.
- The edge of the 24h window. The rolling 24h columns are built from 5-minute candles. The candle at the far edge of the window is only partly inside it, so Coinlyzer counts that part pro rata. The result can differ from an exchange’s figure by up to one 5-minute candle’s move.
- RSI. Coinlyzer uses the standard 14-period RSI with Wilder’s smoothing, as TradingView and the exchanges do, over Coinlyzer’s recent history: at least the last 100 candles. Charts that use a longer history can show a slightly different value, as can charts that skip candles with no trades (Coinlyzer counts them as flat). The difference is usually small and shows up mostly on thinly traded pairs.
Still different?
If you’ve compared the same pair, on the same exchange, in the same window, and the numbers still disagree, tell us at support@coinlyzer.com. Include the pair, the exchange, the column and the time in UTC, and we’ll check it against the exchange’s raw data.
FAQ
Why is Coinlyzer’s 1d change different from my exchange’s 24h change?
The 1d column is today’s daily candle, which starts at 00:00 UTC. The exchange’s 24h change looks back exactly 24 hours. Compare it with Coinlyzer’s 24h Chg column instead.
What time zone does Coinlyzer use?
UTC, for every candle on every exchange. Daily candles close at 00:00 UTC, weekly candles at 00:00 UTC on Monday.
Why is volume shown in dollars?
So pairs quoted in USDT, USD, EUR, TRY and other assets can be compared and sorted together. Coinlyzer converts each pair’s volume with a live rate.
Why is the RSI slightly different from TradingView?
Both use 14-period RSI with Wilder’s smoothing. Coinlyzer calculates it over at least the last 100 candles and counts candles without trades as flat, so values can differ slightly, mostly on thinly traded pairs.
All guides
How to use Coinlyzer
Related
Coinlyzer shows market data only. Screens and examples in this guide show how the product works; they are not investment advice or a recommendation to buy or sell anything. Screenshots may differ slightly from the app as it improves.