
Most price apps give you one number per coin: the change over the last 24 hours. Coinlyzer gives you hundreds, and that can look like a lot at first. It isn’t, once you see the pattern. Every column is built the same way, from three parts.
Three parts
Each column answers three questions:
- What is measured? The metric: change, volume, RSI and so on.
- Over how long? The timeframe: a 5-minute candle, a 1-hour candle, a daily candle…
- Which candle? The one still forming (Now) or the one that just closed (Last).
So “1h candle change, Now” is the change of the current hourly candle so far. “1d volume, Last” is how much traded in yesterday’s daily candle, in US dollars. Nine metrics, seven timeframes and two candles give you every column in the screener.
The metric: what is measured
| Metric | What it tells you | Example value |
|---|---|---|
| Candle change | Close vs open of the candle, in %. Green candle above 0, red below. | +4.2% |
| Change over N candles | From the open of the first to the close of the last of 2–24 candles in a row. | +11.8% over 3 candles |
| Close vs N-candle high | Close vs the highest high of the 10, 20 or 50 candles before it. Above 0 is a breakout. | +1.3% |
| Green/red streak | Candles in a row that closed up (+) or down (−). | +4 |
| Candle volume | Traded volume in the candle, in US dollars. | $2.3M |
| Volume vs previous | This candle’s volume vs the candle before it. | +180% |
| Volume vs 20-candle average | This candle’s volume vs the average of the 20 before it. +100% is twice the usual. | +240% |
| Candle range | High vs low of the candle, in %: how far price swung. | 6.4% |
| RSI (14) | Relative Strength Index over 14 candles, from 0 to 100. | 71.5 |
The three extra columns are there for comparison. 24h change and 24h volume are rolling windows, the same numbers most price apps show. They don’t follow candles, so they can disagree with the daily candle. Our article on 24h change vs the daily candle explains why.
The timeframe: how long each candle lasts
Seven timeframes: 5m, 15m, 30m, 1h, 4h, 1d and 1w. Candles start and end on UTC time, exactly like the exchanges’ charts: the daily candle runs from 00:00 to 24:00 UTC, the 4-hour candles start at 00:00, 04:00, 08:00 and so on, and weekly candles start on Monday.
Coinlyzer builds every candle itself from 1-minute data, so all three exchanges use the same boundaries. That matters for Coinbase, which has no 4-hour candles of its own, and for Kraken, whose own weekly candle starts on Thursday. Not sure when the next candle closes where you live? The candle close countdown shows it in your time zone.
The candle: Now or Last
Now measures the candle that is still forming. Its values move all the time and reset when a new candle starts. Last measures the most recent candle that has closed. Its values stay fixed until the next close.
Measures over several candles count back from the candle you pick. “Change over 3 candles, Now” covers the live candle and the two before it; “Last” covers the last three closed candles. The choice between the two is important enough to have its own guide.
Reading a header
Column headers are short, so they use a few marks:
| Header | Reads as |
|---|---|
| 1h Chg | 1-hour candle change, live candle (Now) |
| 1h Chg ◂ | 1-hour candle change, last closed candle (Last). The ◂ means “Last”. |
| 1h×3 Chg | Change over the last 3 hourly candles, ending with the live one |
| 4h Vol | 4-hour candle volume in USD, live candle |
| 4h RSI | RSI (14) on 4-hour candles, using the current price |
| 1d vs Hi20 ◂ | Yesterday’s close vs the highest high of the 20 daily candles before it |
| 24h Chg | Rolling 24-hour change (no candle) |
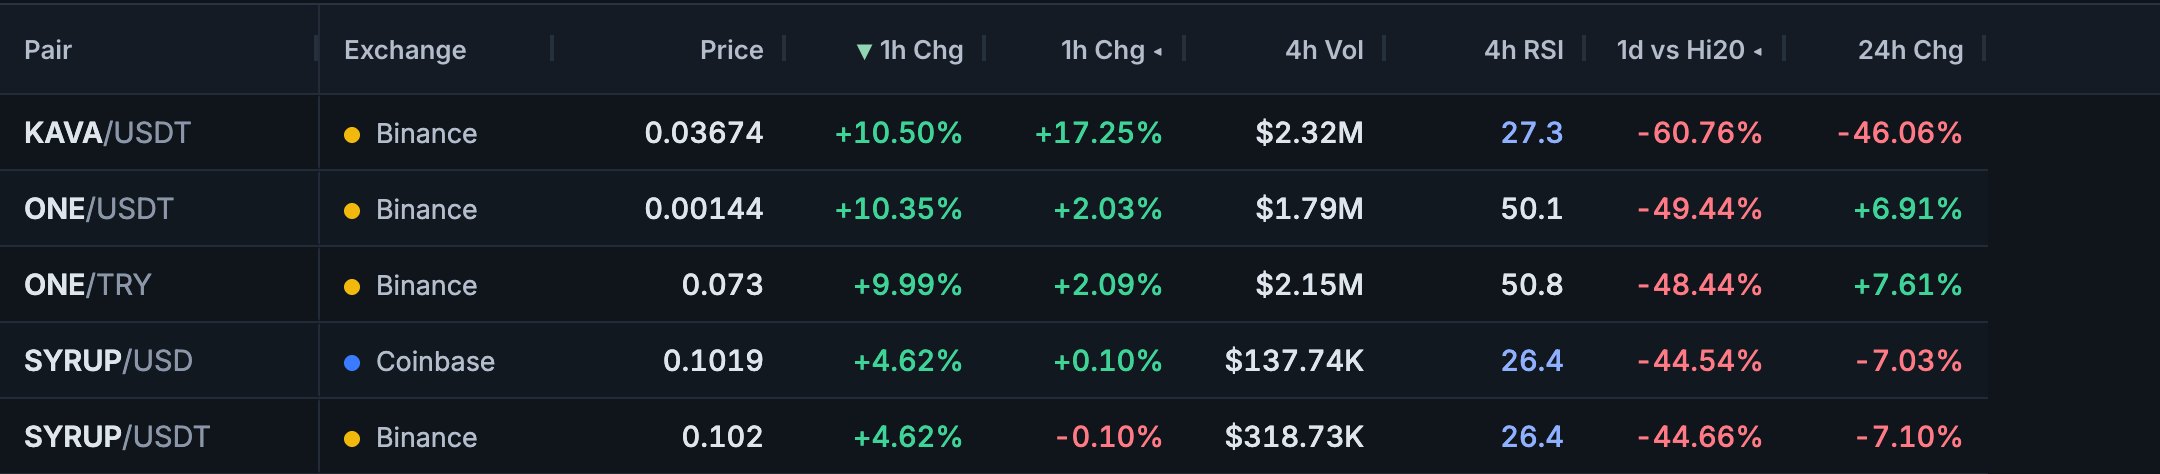
Hover over a header to see the column’s full name.
Reading the values
- Percent for changes, ranges and volume comparisons. Green is above zero, red below.
- US dollars for volume, on every exchange. A pair quoted in EUR or TRY is converted, so you can compare volume across exchanges and quote currencies in one column.
- RSI from 0 to 100. Values of 70 and above are shown in amber, 30 and below in blue: the zones traders usually call overbought and oversold.
- Streaks as a count: +3 is three green candles in a row, −2 two red ones.
A value flashes briefly when it changes. The flash is neutral white on purpose, so it isn’t mistaken for a rise or a fall.
Adding a column
Click Columns on the app bar. The panel is laid out exactly like the three parts: one row per metric, one column per timeframe, and a Now and a Last button in each cell. Click a button to add that column; click it again to remove it. Highlighted buttons are columns already in your table.
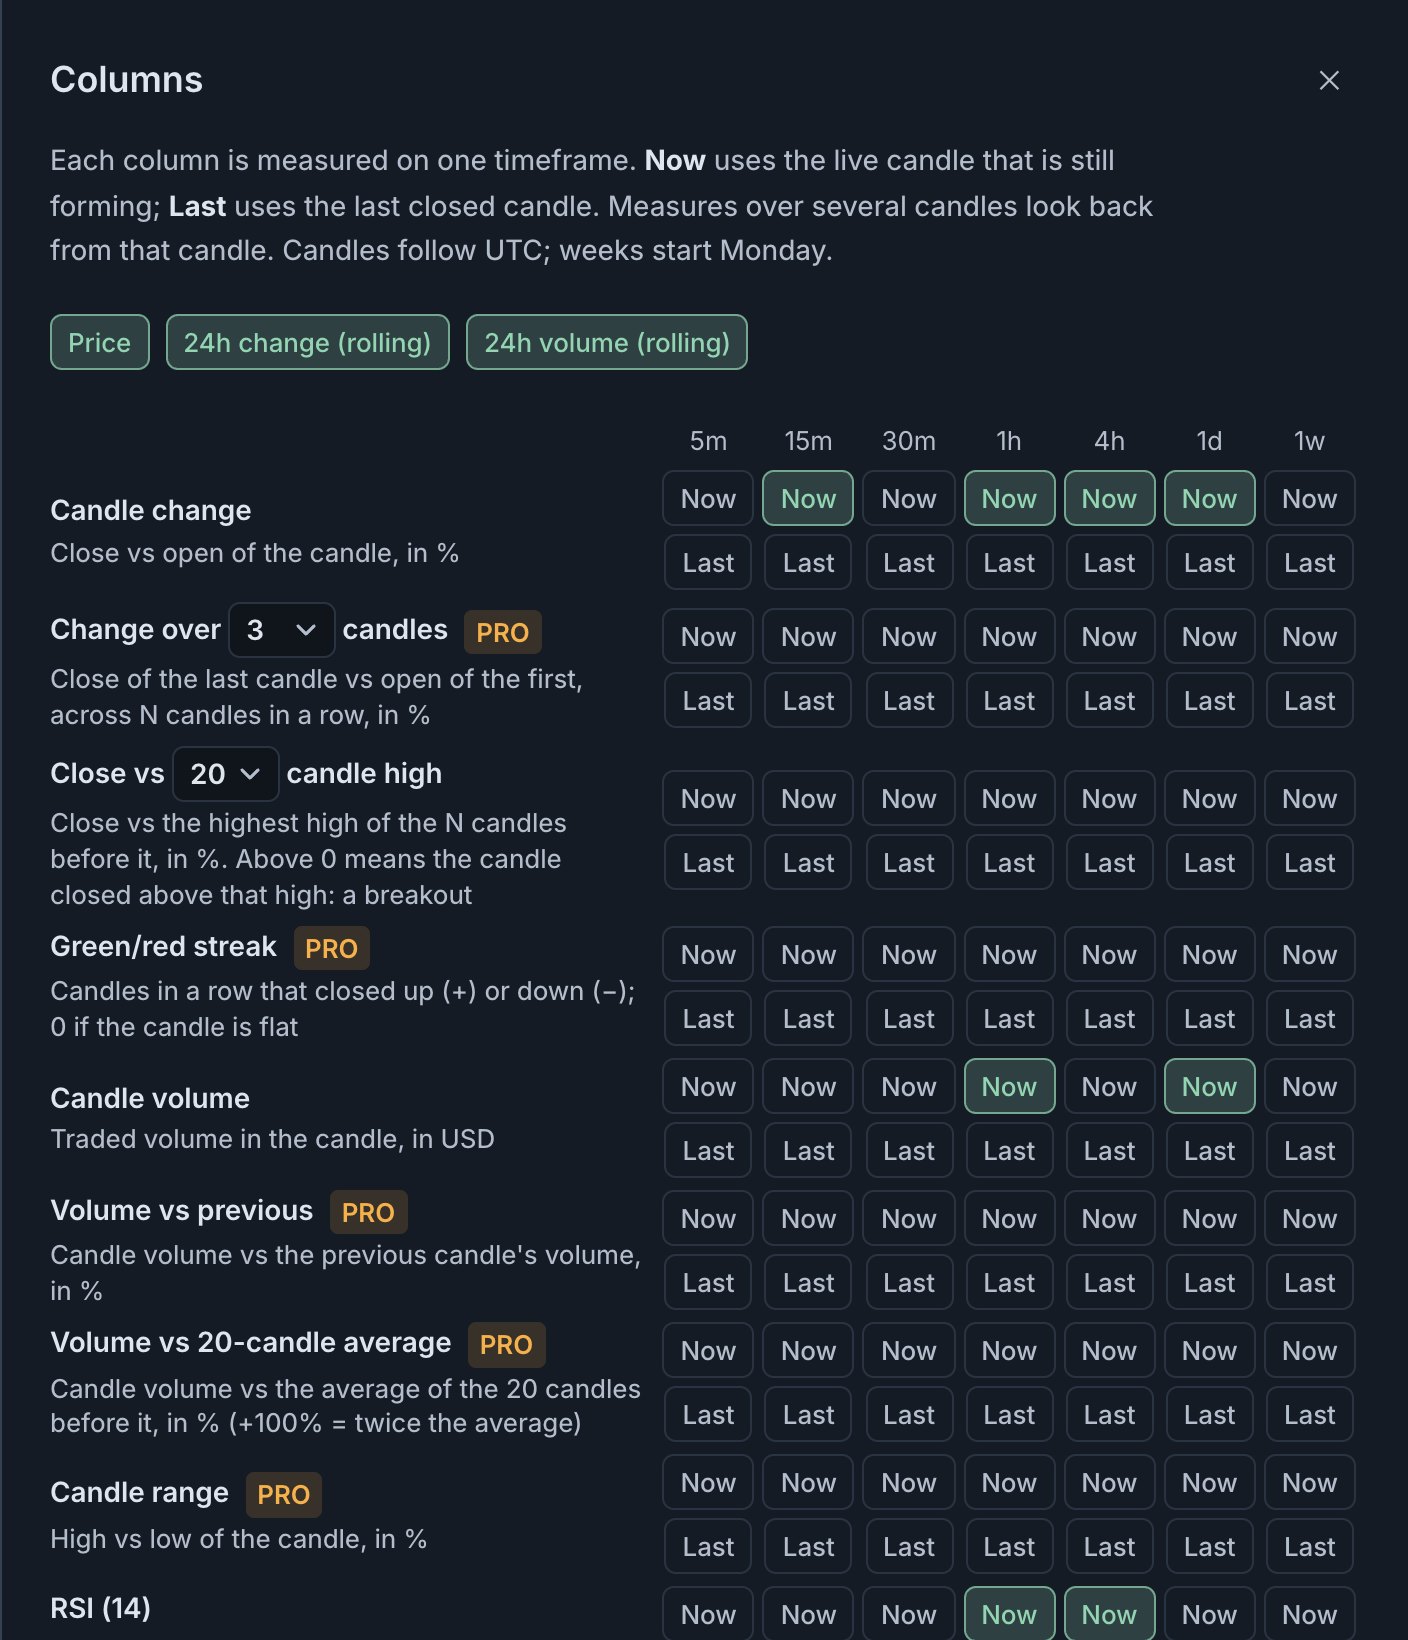
For Change over N candles and Close vs N-candle high, pick the number of candles in the small menu first, then click Now or Last. A • in that menu marks counts you already have columns for.
Try it now
Open the Columns panel and add “1h Chg” and “1h Chg ◂” next to each other. Watch how differently they move.
FAQ
What does the ◂ after a column name mean?
It marks the last closed candle (Last). A header without it uses the live candle that is still forming (Now).
Why is the 1d change different from the 24h change?
The 1d candle starts at 00:00 UTC, so it covers only part of today. The 24h change always covers the last 24 hours, whatever the time. Both are correct; they measure different windows.
When does the daily candle close?
At 00:00 UTC, on every exchange in Coinlyzer. Weekly candles close at 00:00 UTC on Monday.
Why is volume shown in dollars?
So pairs in different quote currencies and on different exchanges can be compared in one column. Volume is converted to US dollars as it comes in.
How many columns are there?
More than 250: nine metrics on seven timeframes, each for the live and the last closed candle, several candle counts for the multi-candle metrics, plus price and the rolling 24h columns.
Next guide
Now vs Last: the live candle and the closed candle
Now measures the candle that is still forming; Last measures the one that just closed. When to use each, how Now values move, and how to combine them.
Related
Coinlyzer shows market data only. Screens and examples in this guide show how the product works; they are not investment advice or a recommendation to buy or sell anything. Screenshots may differ slightly from the app as it improves.