
A candle isn’t finished until it closes. Until then, its change, volume and RSI are a story still being written. Coinlyzer lets you read it either way: Now shows the candle as it forms, Last shows the one that just closed. Every candle column and every rule offers both.
Side by side
| Now (live candle) | Last (closed candle) | |
|---|---|---|
| Measures | The candle that is still forming | The most recent candle that has closed |
| In headers | 1h Chg | 1h Chg ◂ |
| In rules | now (live candle) | last closed candle |
| Values change | All the time, until the candle closes | Once per candle, at the close |
| Good for | Catching a move while it happens | Confirming how a move ended |
| Watch out for | Moves that fade before the close | Being one candle late |
Here are both, for the hourly and the daily candle, in the same table:
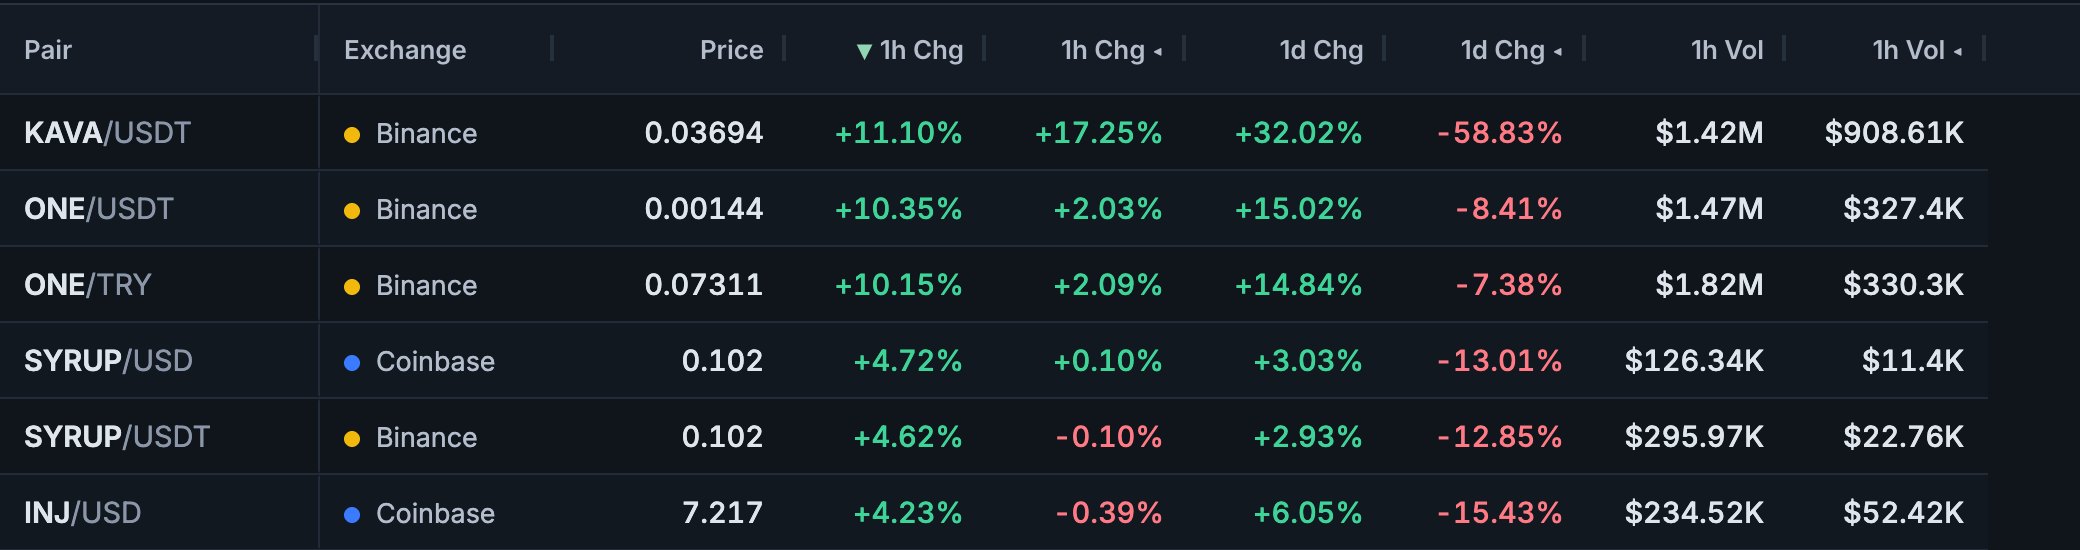
How Now values move
Now values start over every time a new candle opens. In the first minutes of an hourly candle, its change is close to zero and its volume is small, simply because little time has passed. Keep that in mind when you build rules:
- Change can swing a lot early in a candle and settle later. A 1-hour candle that is up 4% after five minutes may close up 1%, or up 9%.
- Volume grows through the candle. “4h volume, Now, above $1M” rarely matches in the first minutes of a 4-hour candle and often matches near its end.
- Volume vs average, Now compares the partial candle with 20 full ones. If it is already above +100% halfway through the candle, volume really is heavy.
- RSI, Now uses the current price as the candle’s close, so it moves with every trade.
Longer timeframes make this stronger. Early in the UTC day, the daily candle covers only a few hours. That’s why “1d Chg” can look very different from the 24-hour change, as our 24h vs daily candle article shows.
How Last values move
Last values don’t move during the candle. “1h Chg ◂” shows the hour that just closed, and stays the same until the next hourly close, when it jumps to the new value. A screen built on Last rules is calm: its list changes at candle closes, not every second.
That calm is the point. Exchanges and charting tools treat a closed candle as final, and many traders only act on closes. A breakout that closes above resistance is a different thing from one that pokes above it for ten minutes. In our study of 6,100 daily breakouts, more than half were gone by the close.
Which one to use
| If you want to… | Use | Why |
|---|---|---|
| Spot a move early, while you can still act on it | Now | It shows the move as it happens |
| Find pairs whose candle closed strong | Last | The close is final; the live candle isn’t |
| Scan once or twice a day on daily candles | Last | The live daily candle may be only a few hours old |
| Catch a volume spike as it builds | Now | Volume vs average shows heavy trading before the candle ends |
| Follow a trend across several candles | Last | Closed candles don’t change; streaks and N-candle changes stay stable |
Try the same idea both ways and compare the lists:
Hourly candle up 3% so far
Uses Now: pairs whose current hourly candle is up more than 3% so far. Fast, and some will fade before the close.
All exchanges · 24h volume at least $1M · 1 hour candle change (current) above 3%
Hourly candle closed up 3%
Uses Last: pairs whose last hourly candle closed up more than 3%. Slower, but every candle on the list is final.
All exchanges · 24h volume at least $1M · 1 hour candle change (last closed) above 3%
Using both in one screen
The most useful screens often mix the two: a closed candle for the setup, the live candle for what’s happening now. For example: the daily candle closed up more than 3% yesterday, and today’s candle is green so far.
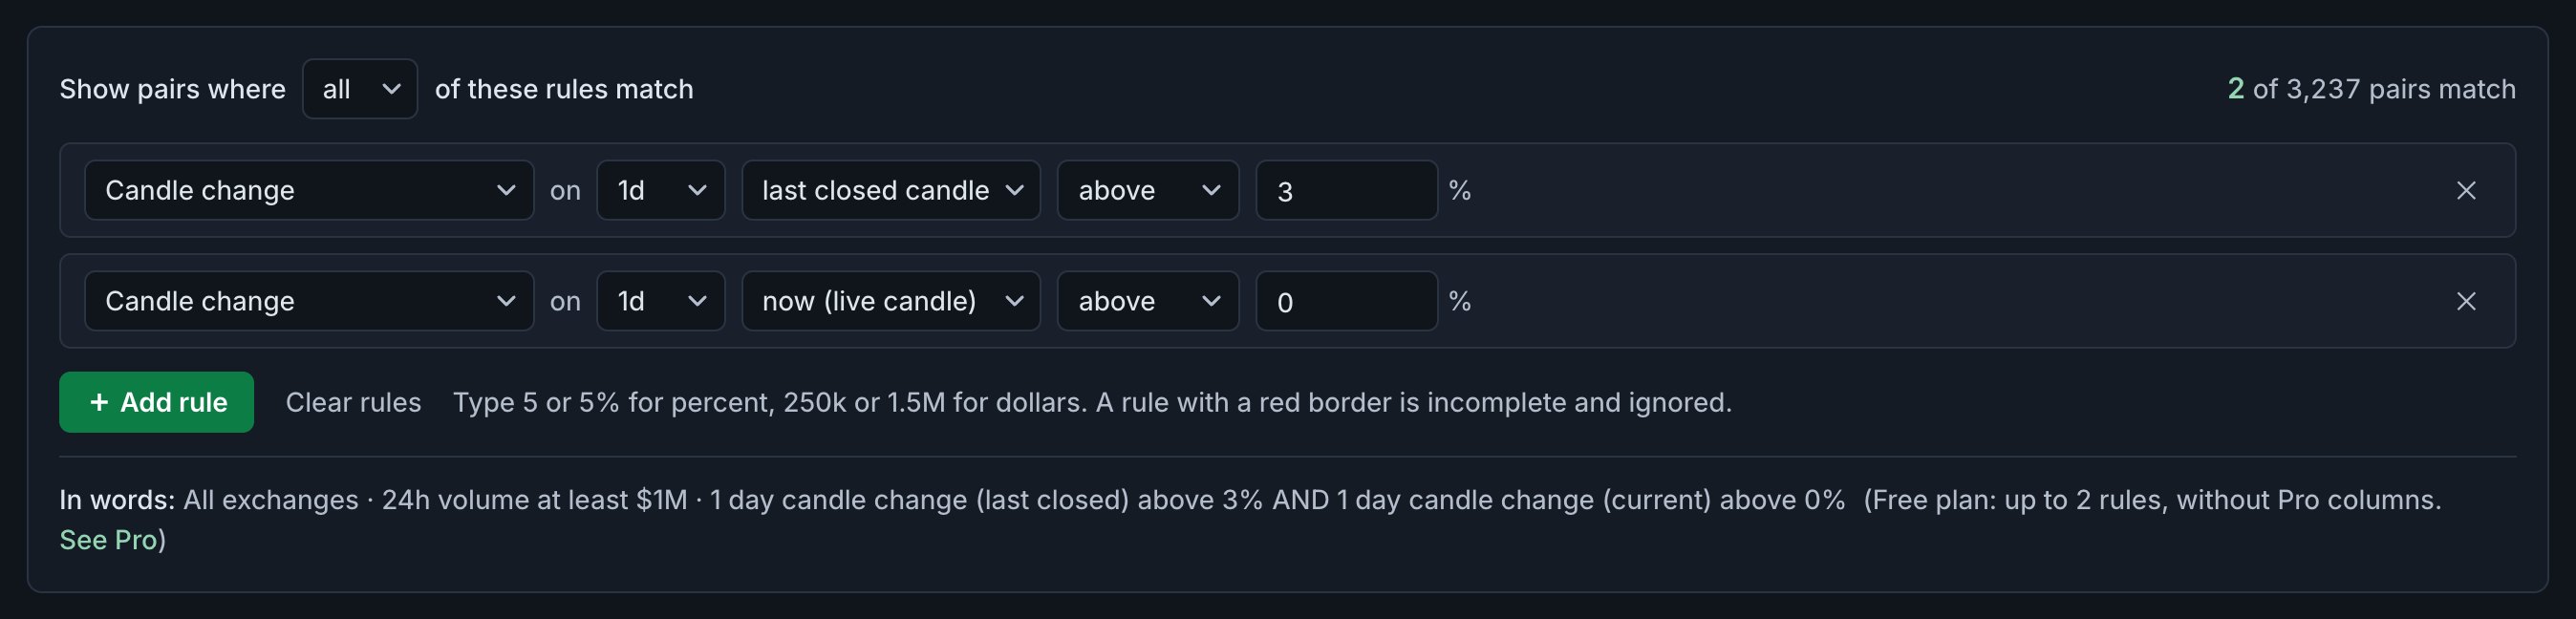
In the rules panel, the third menu in each rule picks the candle: now (live candle) or last closed candle. For measures over several candles it reads ending now (live candle) or ending with last closed.
Green yesterday, still green today
Yesterday’s daily candle closed up more than 3%, and today’s is green so far: strength that is holding into a new day.
All exchanges · 24h volume at least $1M · 1 day candle change (last closed) above 3% AND 1 day candle change (current) above 0%
Now, Last and alerts
An alert fires when a pair starts matching a screen. That makes the choice between Now and Last decide when alerts arrive:
- Rules on Now can fire at any moment during a candle, as soon as the live values cross your thresholds.
- Rules on Last can only start matching when a candle closes, so alerts arrive right after the close.
FAQ
What does “Now” mean in Coinlyzer?
Now measures the candle that is still forming. Its values change until the candle closes and start over when the next candle opens.
What does “Last” mean?
Last measures the most recent closed candle. Its values stay fixed until the next candle closes. In column headers it is marked with ◂.
Why does my Now column show almost nothing at the start of the hour?
A new candle has just opened, so its change is near zero and its volume is small. Values build up as the candle runs.
Which is better, Now or Last?
Neither. Now is earlier but less reliable; Last is final but one candle behind. Many good screens use Last for the setup and Now for what is happening at the moment.
Does Last match the candle on my exchange’s chart?
Yes for 5-minute to daily candles: they use the same UTC boundaries as the exchanges. Weekly candles start on Monday for every exchange in Coinlyzer; Kraken’s own charts start the week on Thursday.
All guides
How to use Coinlyzer
Related
Coinlyzer shows market data only. Screens and examples in this guide show how the product works; they are not investment advice or a recommendation to buy or sell anything. Screenshots may differ slightly from the app as it improves.