
The screener fits on one page. The bar at the top decides which pairs you see and how they’re shown; the table shows them, live; the bar at the bottom tells you the data is flowing. Here’s every part, in the order your eye meets it.
The map
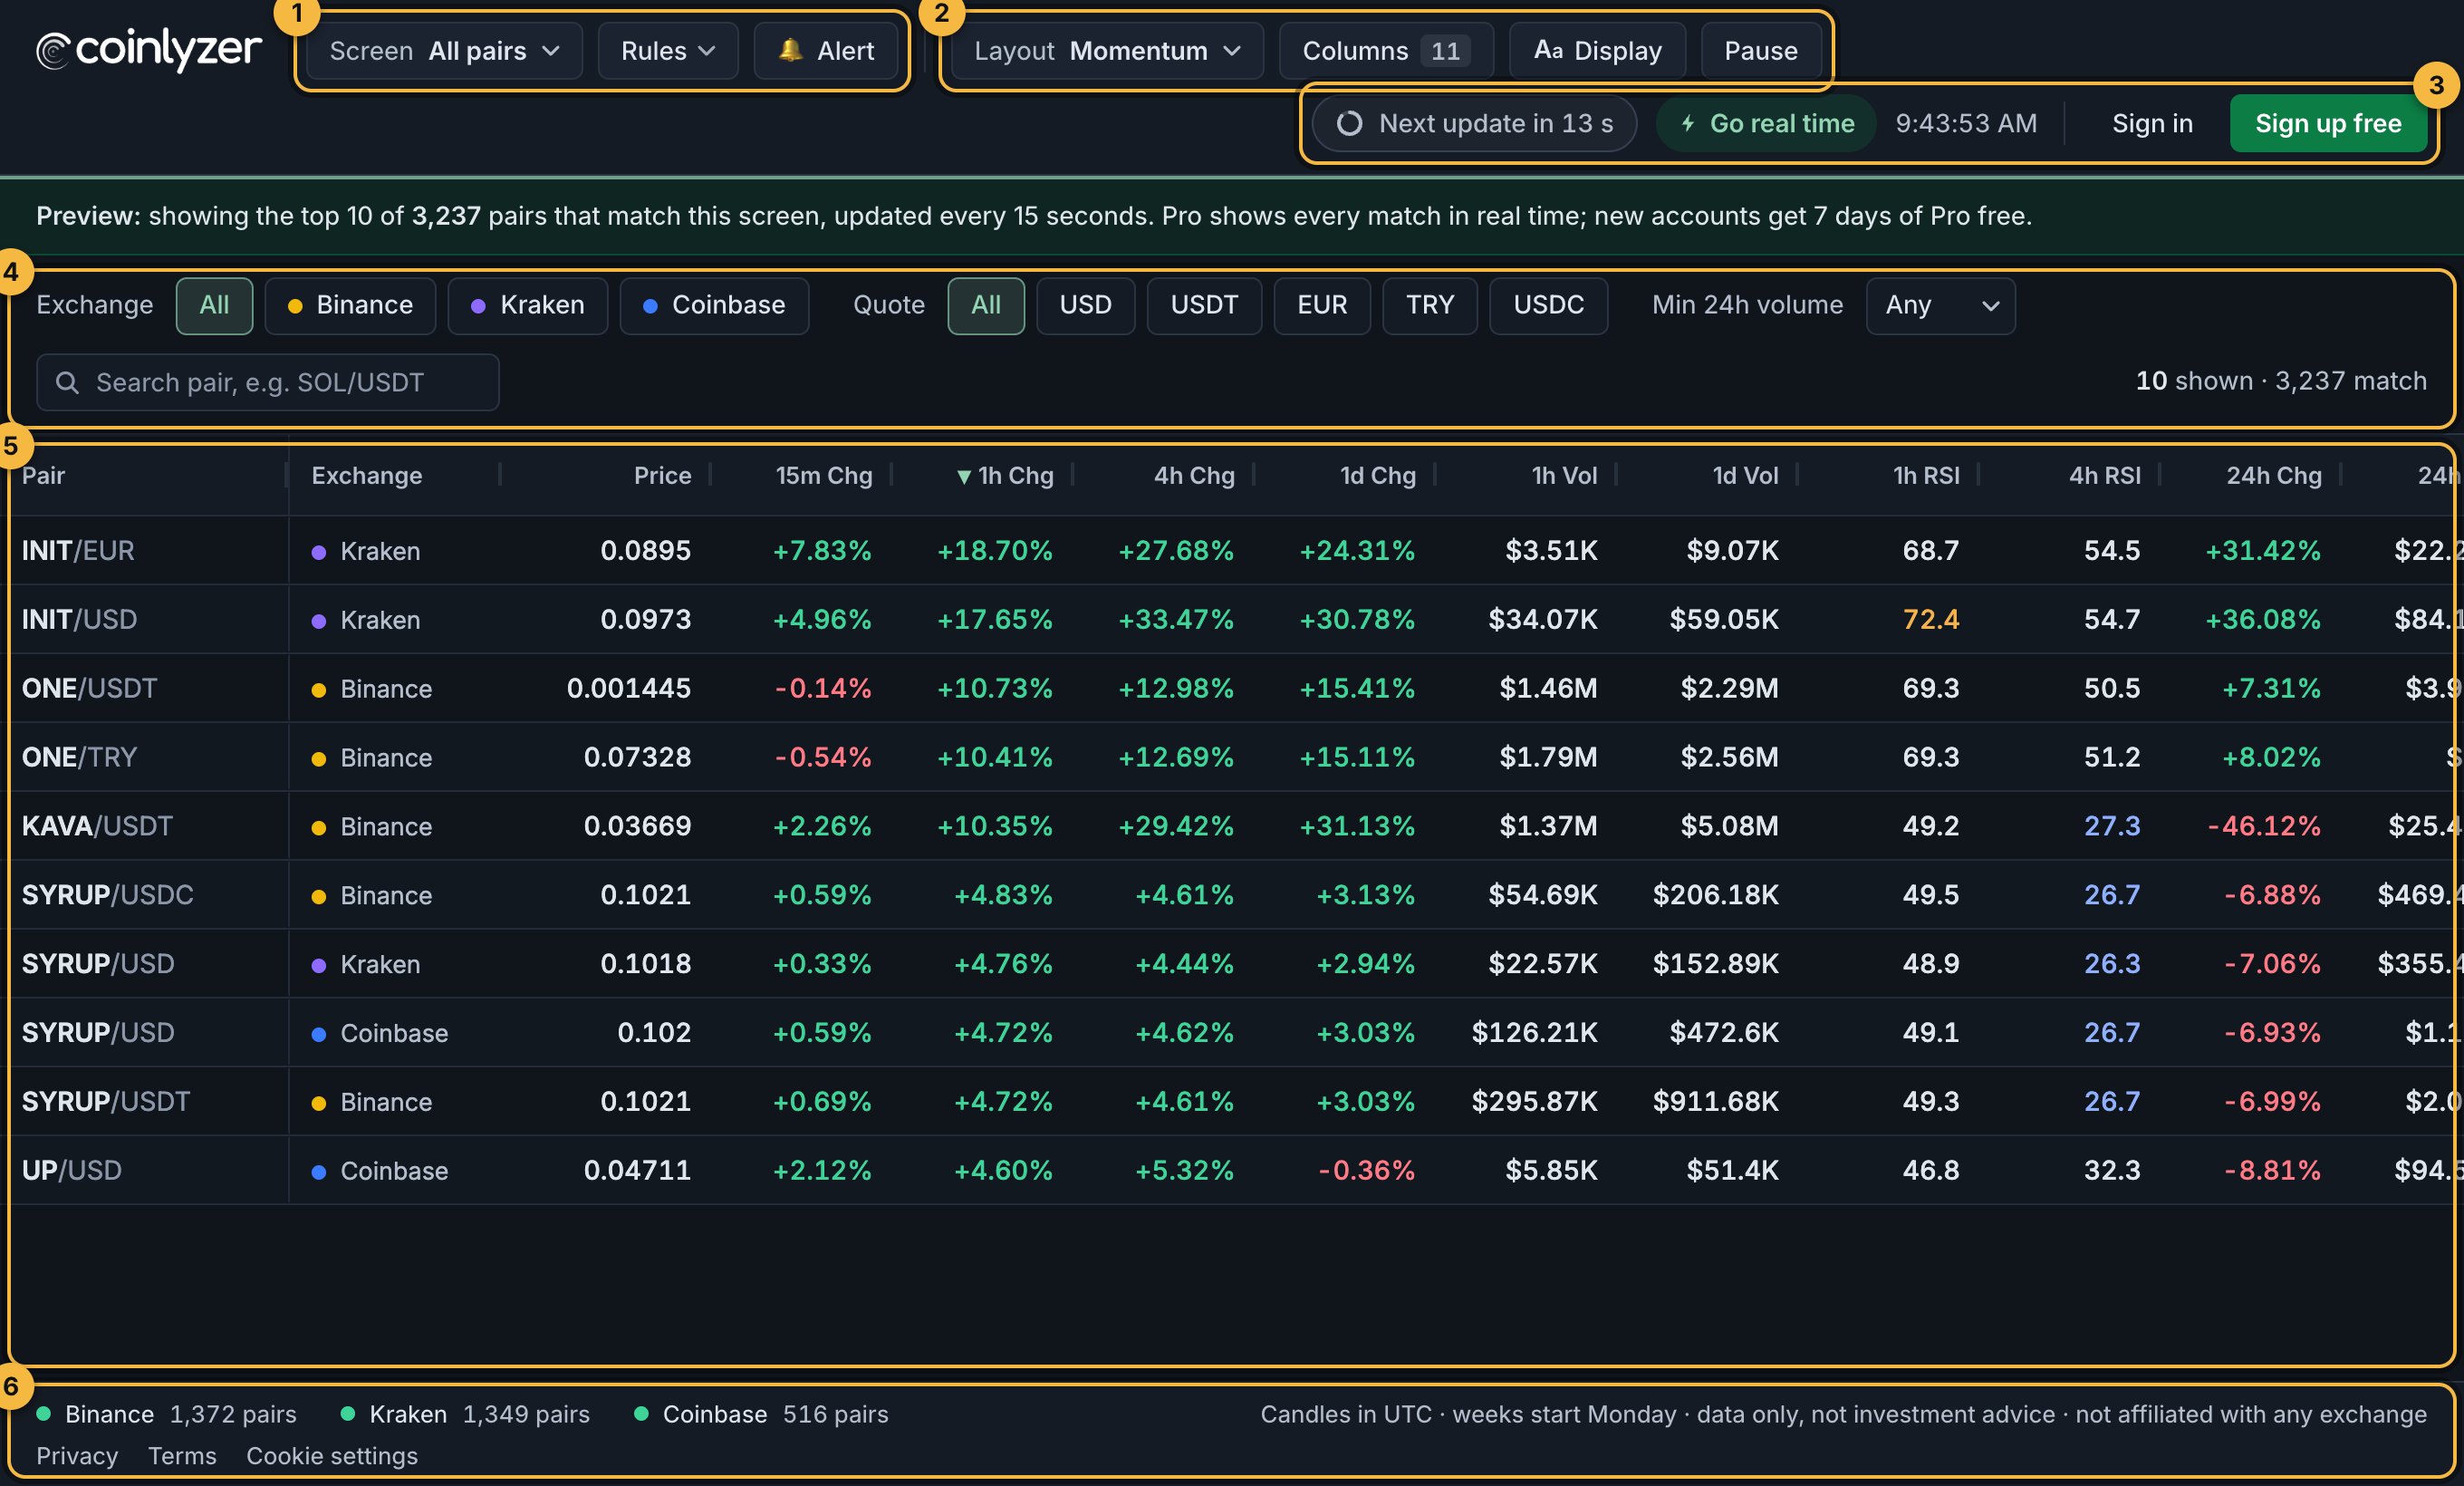
Left to right, the app bar reads like a sentence: this screen, with these rules, shown in this layout. Areas 1 and 2 are the two halves of that sentence.
1 · What you screen
- Screen holds the question you’re asking: its rules and its filters. The menu lists seven presets, your saved screens, a box to save the current screen under a name, and Copy share link. An orange dot next to the name means you’ve changed the screen since you opened or saved it.
- Rules opens the rules panel, where you build the question: show pairs where all (or any) of these rules match. The number on the button counts the rules. The panel shows how many pairs match and reads the screen back in plain English.
- 🔔 Alert turns the current screen into an alert: Coinlyzer tells you when a pair starts matching, in the app, on Telegram, by browser push or by email.
2 · How it’s shown
- Layout is the set of columns, their order, widths and pinning. Five presets (Momentum, Multi-candle trend, Volume spikes, RSI scan, Daily & weekly candles), plus your own. Saved layouts keep your changes automatically.
- Columns opens the column picker; the number shows how many columns the table has. Every column is a metric on a timeframe and a candle; this guide explains how to read them.
- Aa Display sets the text size (Small, Medium, Large) and row spacing (Comfortable or Compact). It’s saved in your browser.
- Pause freezes the table so rows stop moving while you read. Click ▶ Resume to catch up; no data is lost.
3 · Status and account
- Live (green) means the table updates in real time, about once a second. Paused, Connecting… or Reconnecting… tell you when it doesn’t. Next to it is the time of the last update.
- On the Free plan and without an account, the table updates every 15 seconds instead. You’ll see Next update in … s with a progress line, and Go real time, which shows what Pro adds.
- Sign in and Sign up free, or, when you’re signed in, your account menu: the email you signed in with, your plan, Manage billing or Upgrade to Pro, and Sign out.
Without an account you’ll also see a green Preview bar under the app bar. It says how many pairs match the screen and how many you can see.
4 · Filters
Filters narrow the market before any rule runs. They belong to the screen, so a saved or shared screen keeps them.
- Exchange: all, or any mix of Binance, Kraken and Coinbase.
- Quote: the currency a pair is priced in: USD, USDT, EUR, TRY, USDC and more.
- Min 24h volume: hides pairs that traded less than $10K, $100K, $1M, $10M or $100M in the last 24 hours. Thin pairs make big moves easily; a floor of $1M removes most of that noise.
- Search: type a coin or pair, such as SOL or SOL/USDT, to find it fast.
On the right, shown · match counts the rows on screen and all pairs that match.
5 · The table
- One row per pair per exchange: SOL/USDT on Binance and SOL/USD on Coinbase are separate rows. The Pair column stays pinned on the left.
- Sort: click a header; click again to reverse. Hold Shift and click another header to add a second sort.
- Arrange: drag a header to move the column, drag its edge to resize. Hover a header for ⋮ (sort, pin left or right, fit width to values) and × (remove).
- Colors: green above zero, red below; RSI in amber at 70 and above, blue at 30 and below. A value flashes white for a moment when it changes.
- On the Free plan, Pro columns show 🔒 instead of a value.
6 · The status bar
Each exchange has a dot and a pair count. Green means live data arrived in the last minute; red means it hasn’t. Right after a restart you may see loading history with a counter while older candles load; multi-candle columns fill in as it finishes. On the right: candles follow UTC and weeks start on Monday.
Try it now
Open the screener and try each area once: pick a preset, open the rules, switch the layout, sort a column.
FAQ
What is the difference between a screen and a layout?
A screen decides which pairs appear: its rules and filters. A layout decides which columns you see and in what order. Any screen works with any layout.
Why does the table say “Next update in 15 s” instead of Live?
Without Pro, and without an account, the table updates every 15 seconds. Pro updates in real time, about once a second.
How do I get the default view back?
Pick “All pairs” in the Screen menu and “Momentum” in the Layout menu. Presets never change, whatever you edit.
Why do I see the same coin several times?
Each pair on each exchange is its own row, because prices and volume differ between them. Use the Exchange and Quote filters, or search, to narrow it down.
Next guide
How Coinlyzer measures: metric × timeframe × candle
Every Coinlyzer column is one metric, on one timeframe, on one candle. How to read a header like “4h Vol/avg ◂”, and how to pick the column you need.
Related
Coinlyzer shows market data only. Screens and examples in this guide show how the product works; they are not investment advice or a recommendation to buy or sell anything. Screenshots may differ slightly from the app as it improves.